Data Insights Agent: Examples & Use Cases
This page provides practical examples of how to use the Data Insights Agent with your Business Central data.
Example images
The screenshots and visualizations shown are examples. Your actual results will depend on your specific Business Central data and question phrasing.
Sales Analysis Examples
Example 1: Sales Trends by Customer
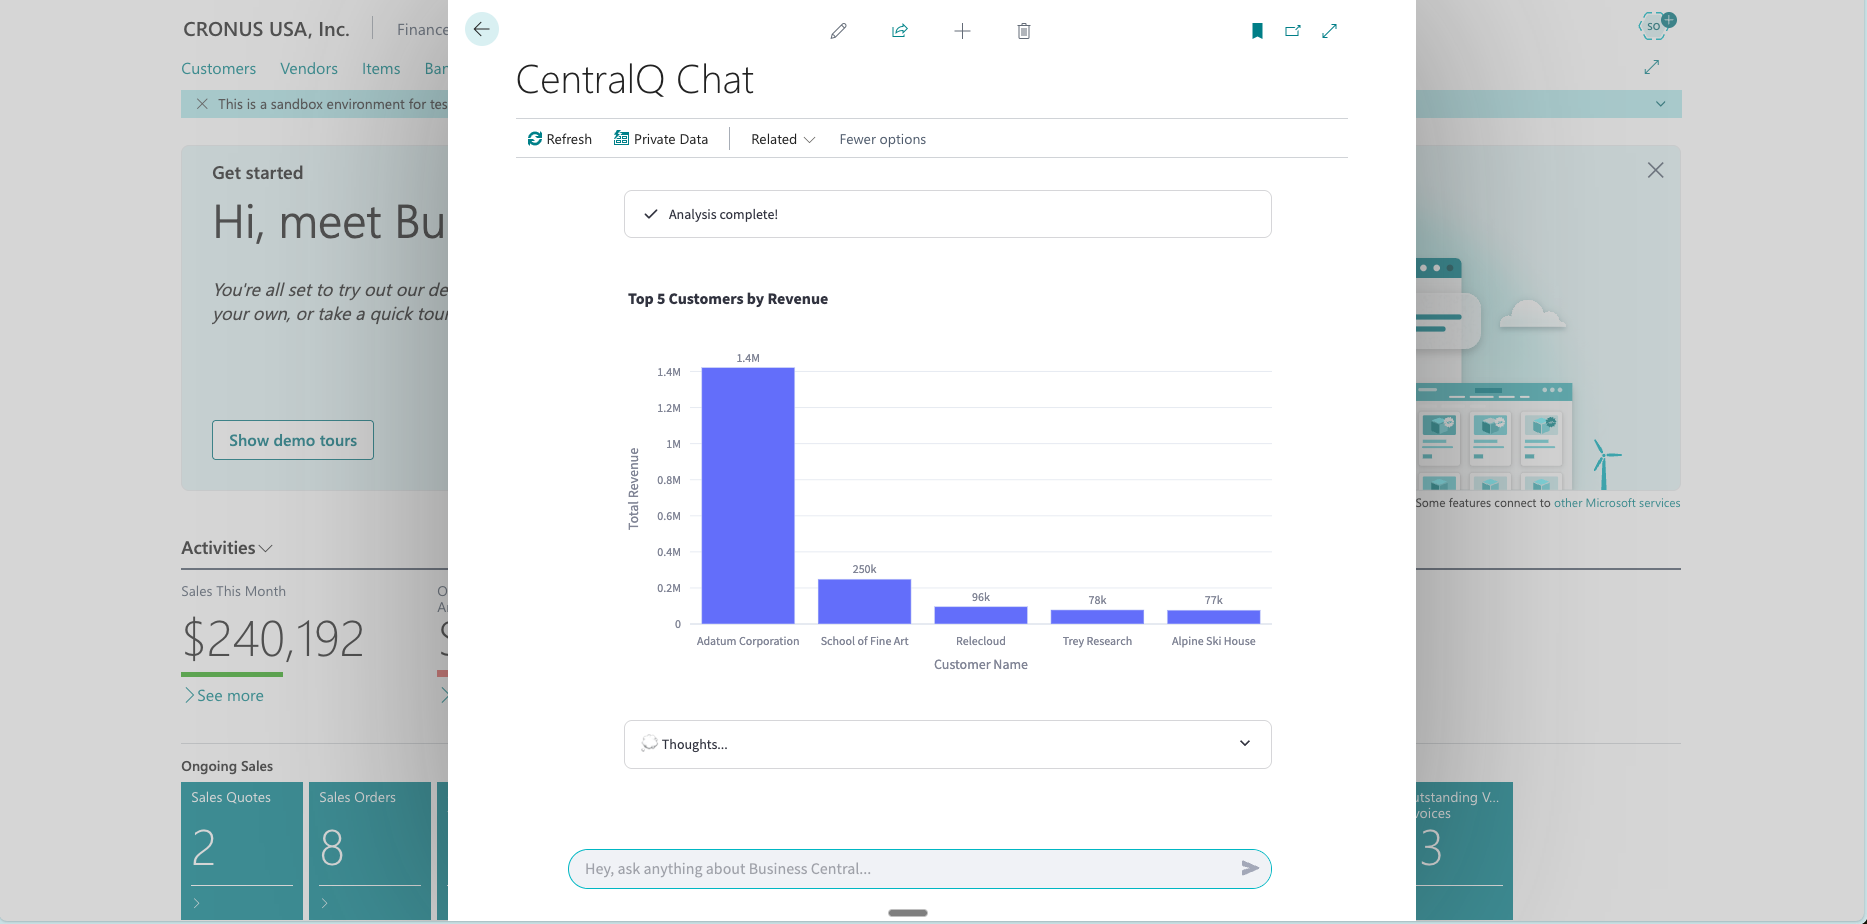
Question: "Show me the top 5 customers by sales amount for the last 3 months and how their purchases have trended over time"
What You'll Get:
- A bar chart showing your top 5 customers by revenue
- A line chart showing the sales trend for these customers
- Analysis of which customers are growing or declining
Business Value: Identify your most valuable customers and spot changing purchasing patterns.
Example 2: Product Performance Analysis
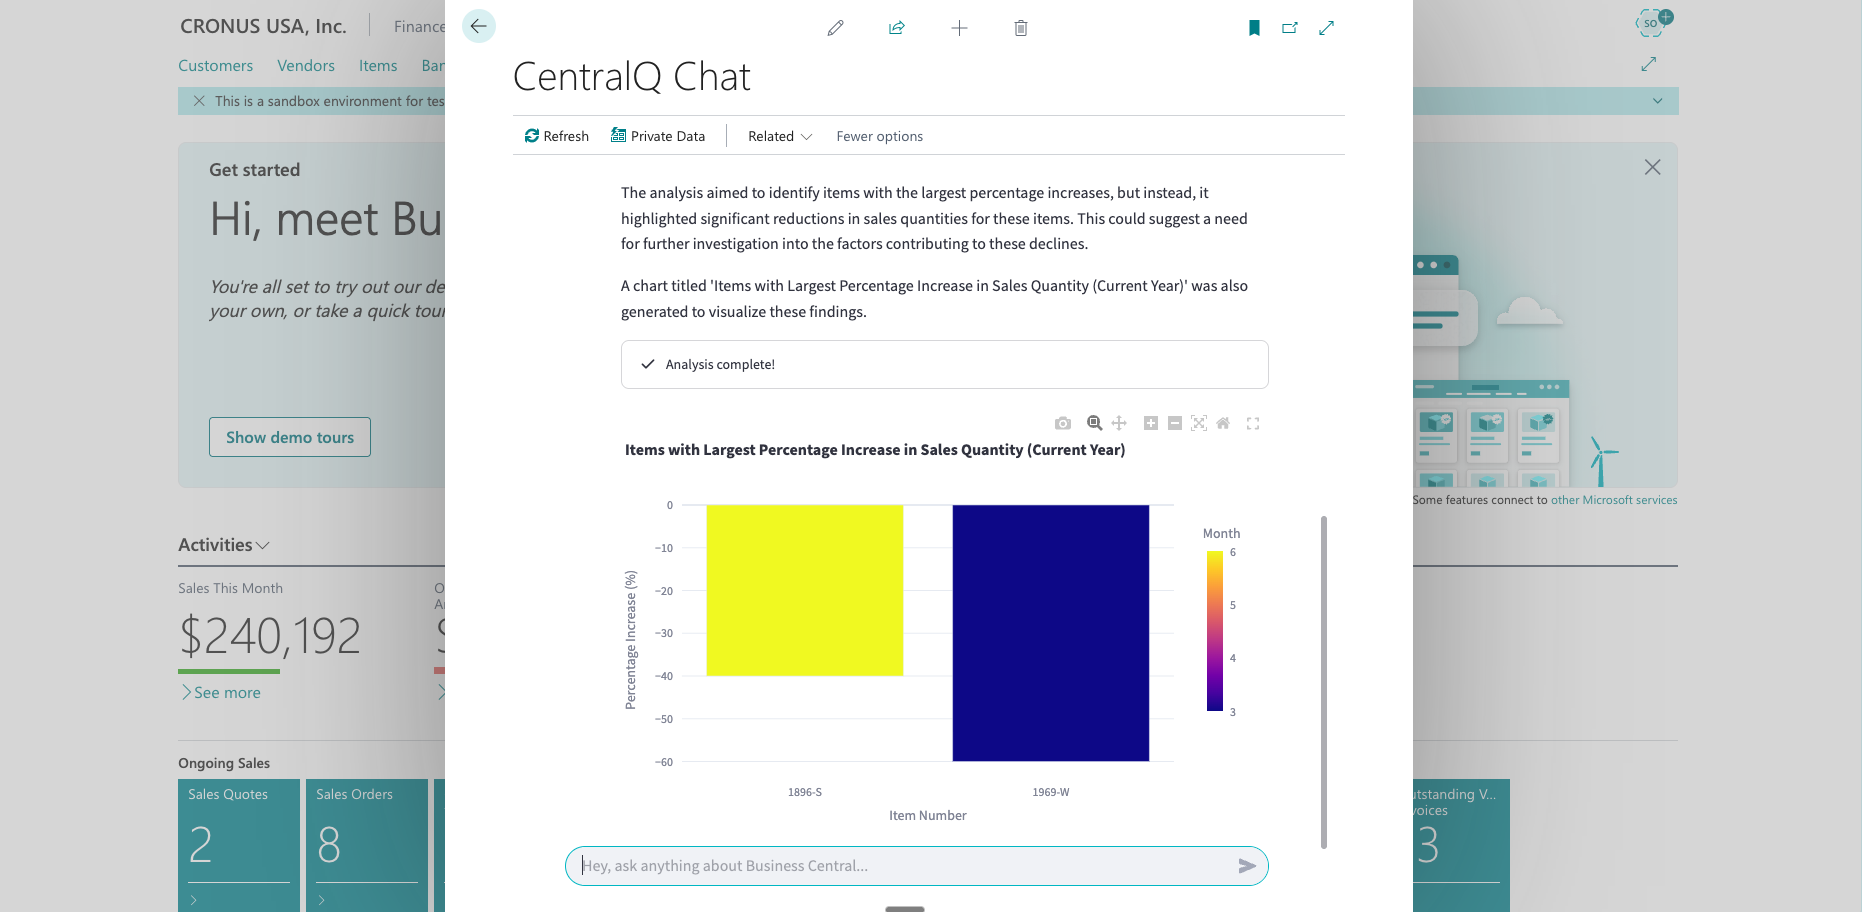
Question: "Which items had the largest percentage increase in sales quantity compared to the previous quarter?"
What You'll Get:
- Visualization of products with significant growth
- Percentage changes in sales quantities
- Identification of emerging popular products
Business Value: Discover growing product trends early to optimize inventory and marketing focus.
Financial Analysis Examples
Example 3: Cash Flow Patterns
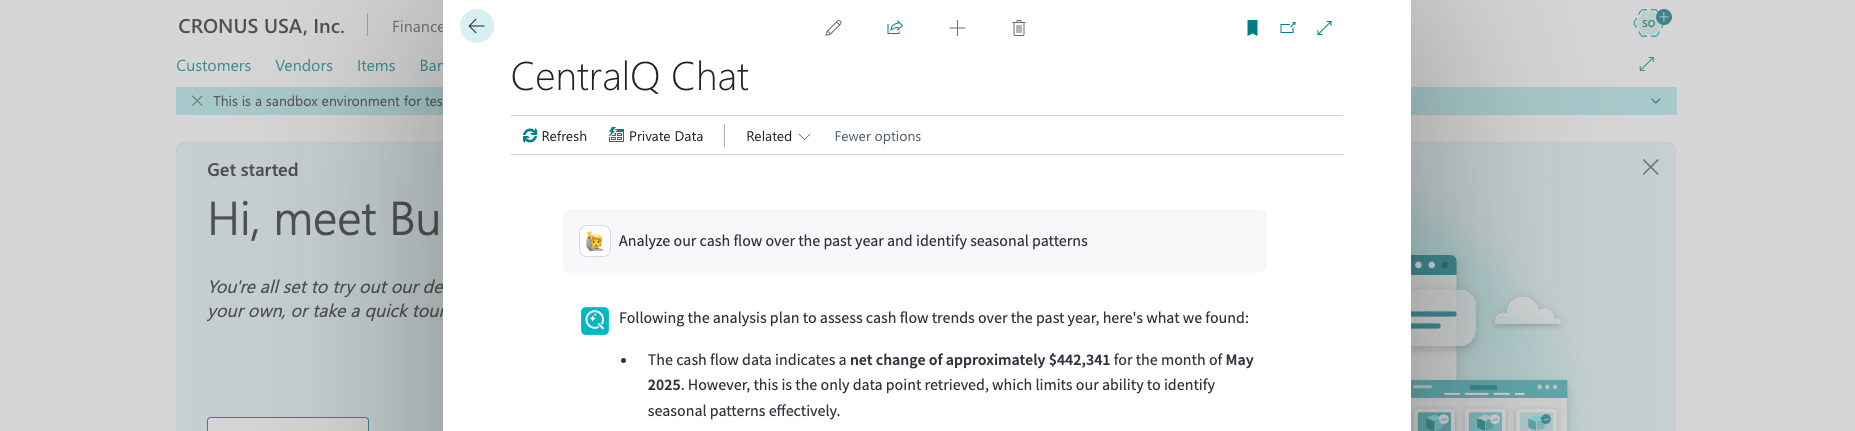
Question: "Analyze our cash flow over the past year and identify seasonal patterns"
What You'll Get:
- Monthly cash flow visualization
- Highlighted seasonal patterns
- Comparison of cash inflows vs outflows
Business Value: Better predict cash position and plan for seasonal fluctuations.
Example 4: Expense Categories Breakdown
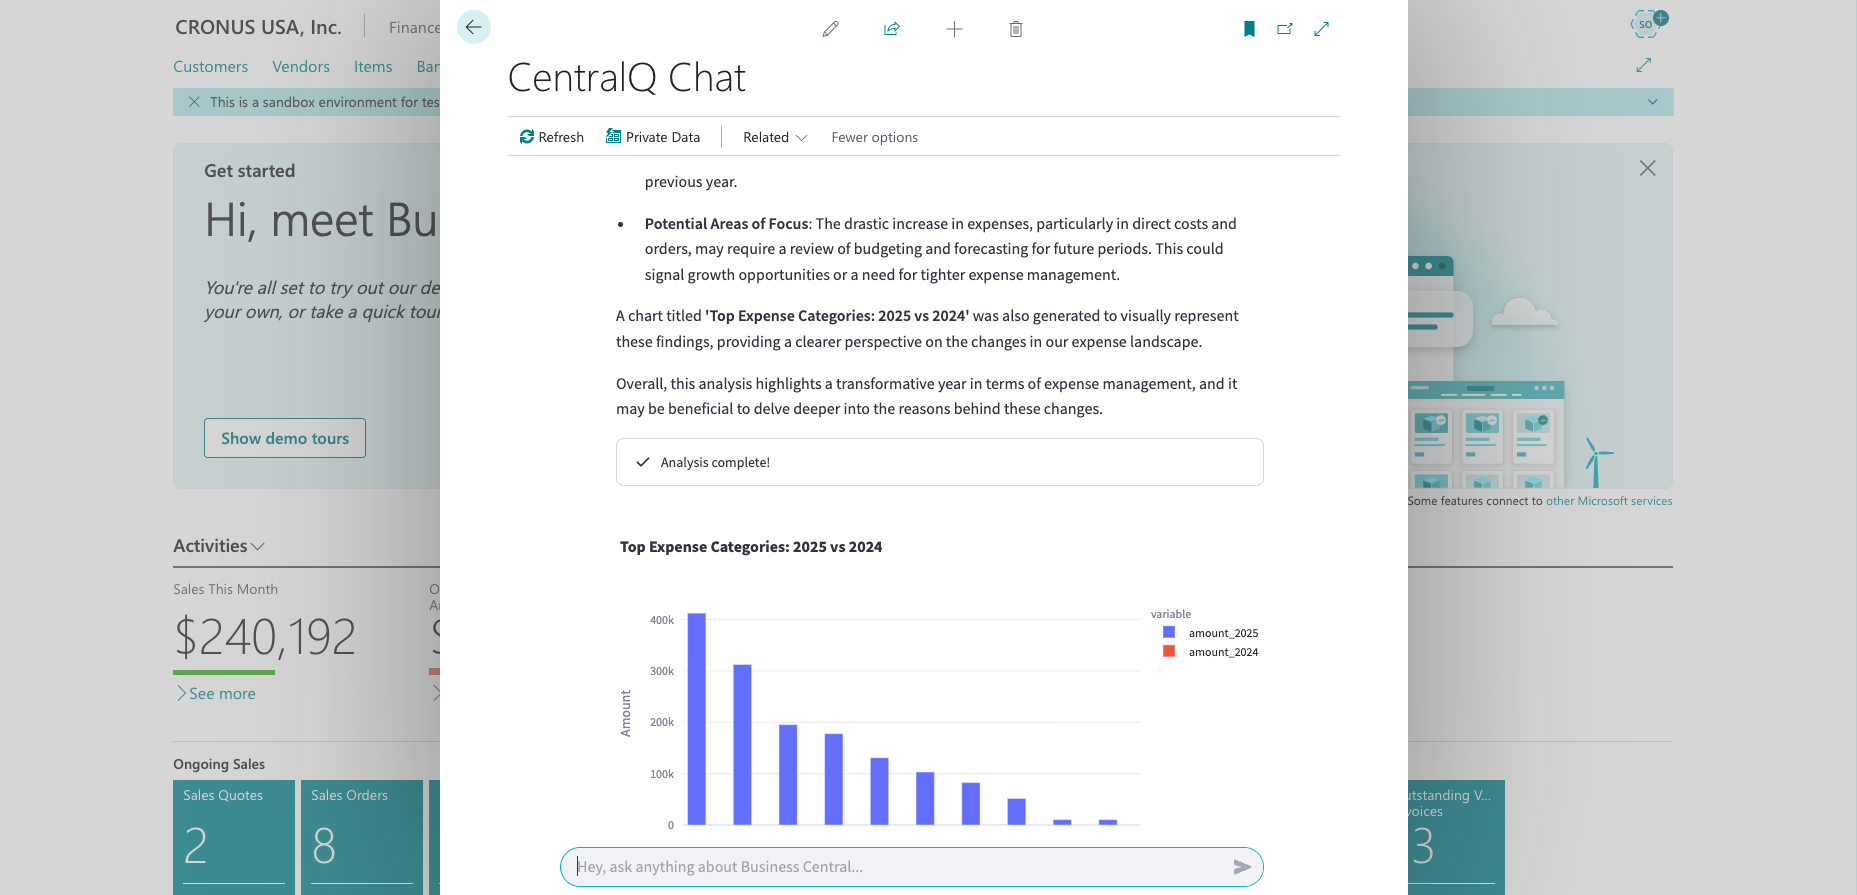
Question: "What are our top expense categories this year compared to last year?"
What You'll Get:
- Comparative visualization of expense categories
- Year-over-year percentage changes
- Identification of growing cost centers
Business Value: Identify cost increases that require management attention.
Inventory Management Examples
Example 5: Inventory Turnover Analysis
Question: "Show me items with the slowest inventory turnover rates in the past 6 months"
What You'll Get:
- Chart of slow-moving inventory items
- Turnover rates compared to average
- Age of inventory metrics
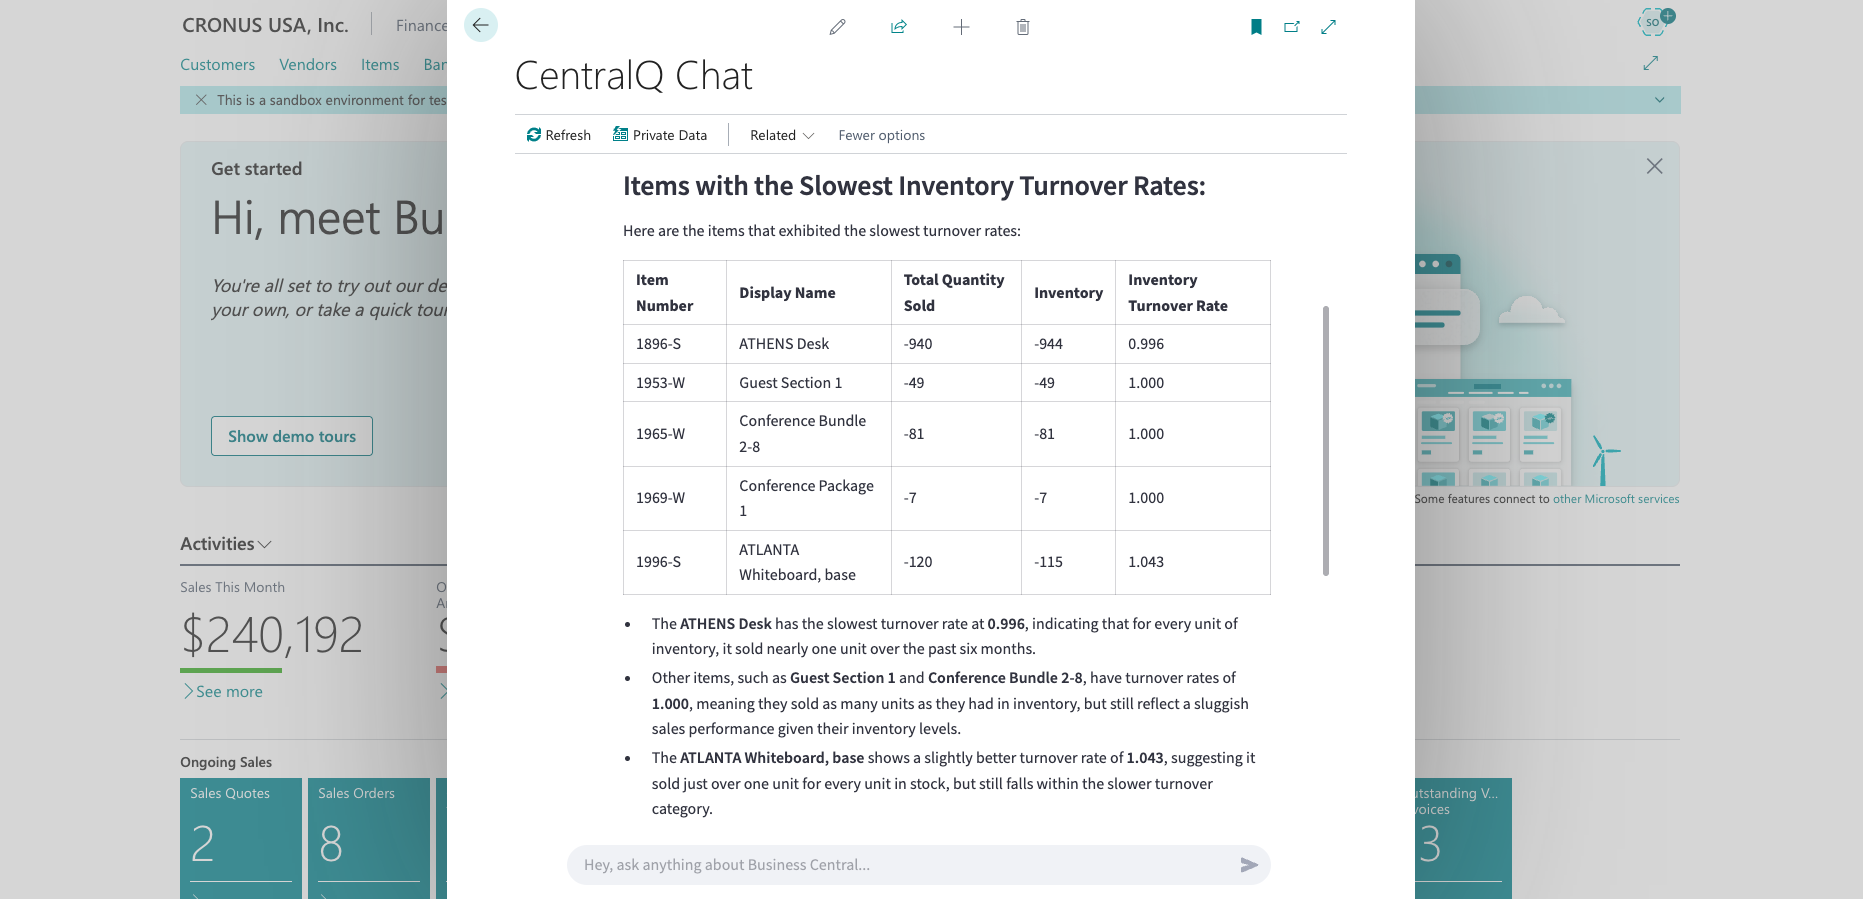
Business Value: Identify potentially obsolete inventory for promotions or write-downs.
Example 6: Stock Level Optimization
Question: "Based on our sales velocity, which items are at risk of stockout in the next 30 days?"
What You'll Get:
- List of at-risk items
- Current stock levels vs projected demand
- Days of supply remaining
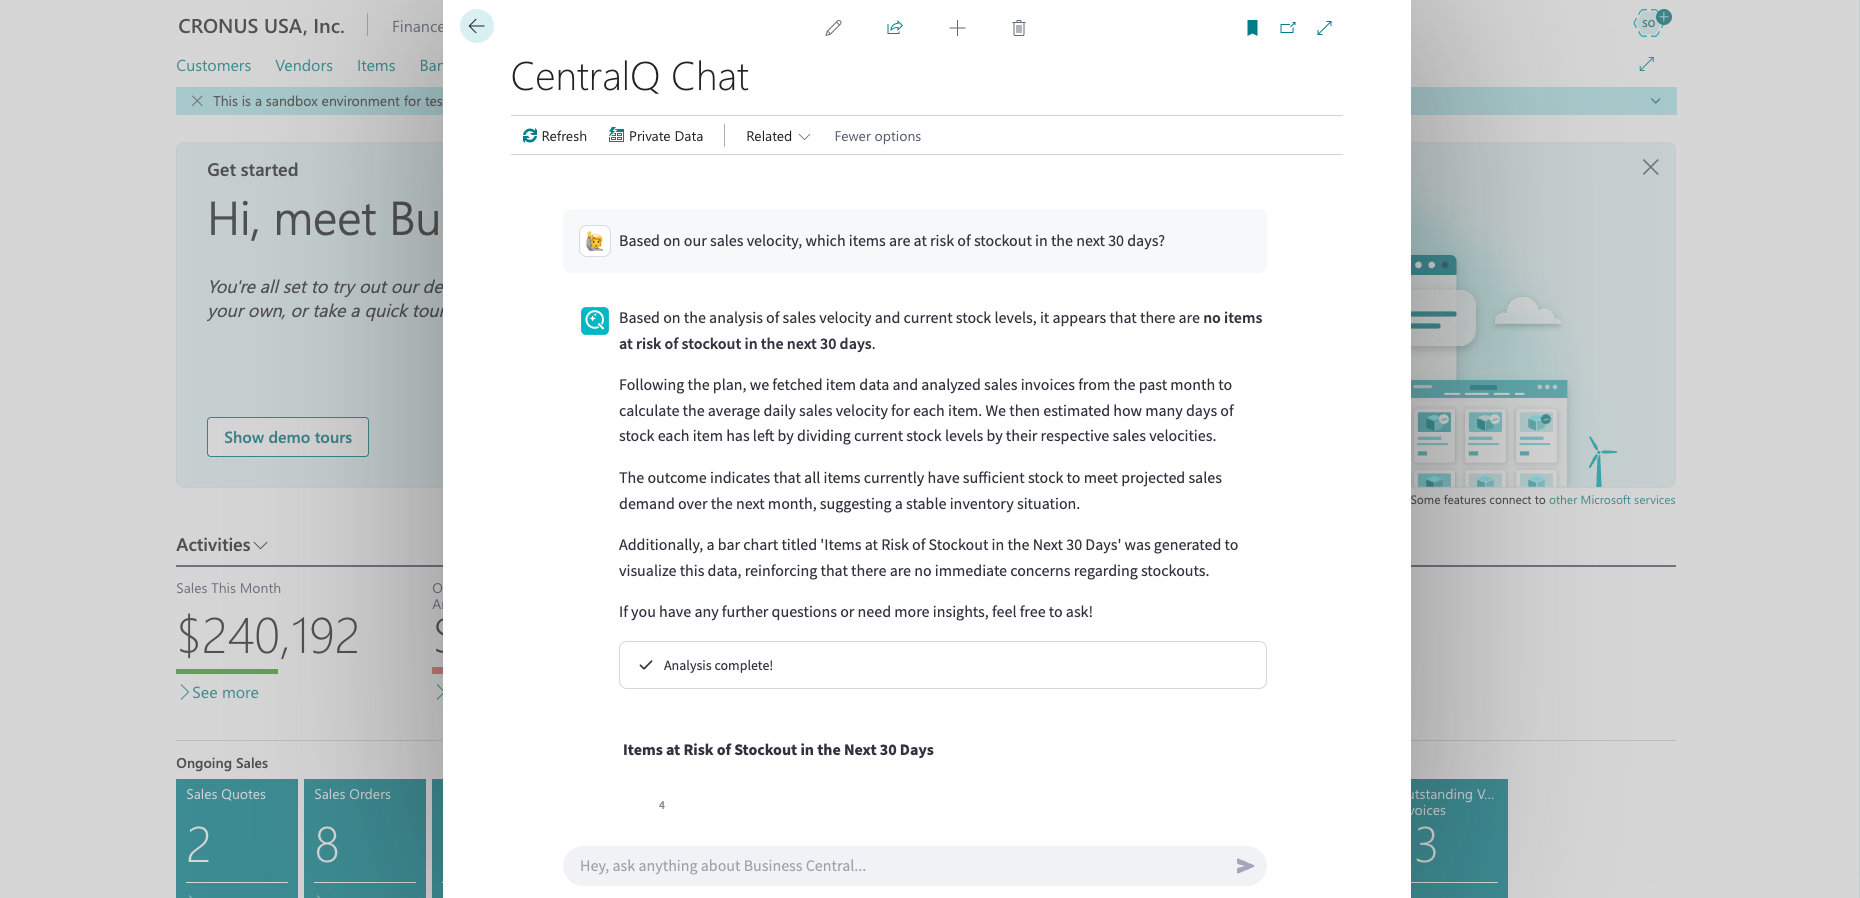
Business Value: Proactively manage inventory to prevent lost sales due to stockouts.
Tips for Effective Queries
To get the most from the Data Insights Agent:
-
Include timeframes: Specify the time period (e.g., "last quarter," "year to date," "past 6 months")
-
Mention specific metrics: Clearly state what you want to measure (sales amount, quantity, profit margin)
-
Ask for comparisons: Request comparative analysis (e.g., "compared to same period last year")
-
Specify visualization types: Request specific chart types if needed (e.g., "show me a trend line")
-
Use follow-up questions: Build on initial queries to explore further
Follow-up Question Examples
Initial: "Show me sales by region for this year"
Effective follow-ups:
- "Which product categories are driving the growth in the Western region?"
- "Compare the customer retention rate between our top and bottom performing regions"
- "What's the profit margin difference between regions?"
Next Steps
- ➡️ Getting Started: Enable and configure the agent
- 🔒 Security: Learn about data privacy and security
- ✨ Key Features: Discover all capabilities